Market Outlook
February 26, 2018
Market Cues
Domestic Indices
Chg (%)
(Pts)
(Close)
Indian markets are likely to open positive tracking global indices and SGX Nifty.
BSE Sensex
1.0
323
34,142
US saw further upside over the course of the trading session. The major averages
Nifty
1.0
108
10,491
showed a significant advance after ending the previous session on opposite sides of
Mid Cap
1.5
240
16,562
the unchanged line. The Dow Jones ended on an upside front of 1.4% to close at
Small Cap
1.5
272
17,996
25,310 and the Nasdaq Composite edged up to 1.8%, to 7,337.
Bankex
1.3
357
28,536
U.K. shares drifted lower as RBS and IAG fell sharply after releasing their earnings
updates. The FTSE 100 was ended on a downside front of 0.1% at 7,244.
Global Indices
Chg (%)
(Pts)
(Close)
Dow Jones
1.4
348
25,310
On domestic front, Indian shares rose sharply and the rupee recovered from three-
Nasdaq
1.8
127
7,337
month lows against the dollar after U.S. government debt yields fell from multiyear
highs, helping ease investor worries over inflation and interest rates. The Sensex
FTSE
(0.1)
(8)
7,244
ended on an upside front of 1.0% at 34,142 while the Nifty ended at 10,491 with
Nikkei
0.8
174
22,067
an upside of 1.0%.
Hang Seng
0.5
164
31,431
Shanghai Com
0.2
7
3,296
News Analysis
Tech Mahindra to invest $79mn in Canada on AI, blockchain technologies
Advances / Declines
BSE
NSE
Detailed analysis on Pg2
Advances
1,905
1,361
Investor’s Ready Reckoner
Declines
854
435
Unchanged
143
51
Key Domestic & Global Indicators
Stock Watch: Latest investment recommendations on 150+ stocks
Refer Pg5 onwards
Volumes (` Cr)
BSE
3,980
Top Picks
NSE
32,320
CMP
Target
Upside
Company
Sector
Rating
(`)
(`)
(%)
Blue Star
Capital Goods
Buy
740
867
17.2
Net Inflows (` Cr)
Net
Mtd
Ytd
Dewan Housing Finance
Financials
Buy
576
712
23.5
FII
(2,263)
(9,634)
3,349
Century Plyboards
Forest Products
Buy
315
400
26.9
Navkar Corporation
Other
Buy
164
265
61.5
*MFs
806
10,111
19,134
KEI Industries
Capital Goods
Buy
373
436
16.8
More Top Picks on Pg4
Top Gainers
Price (`)
Chg (%)
Jpassociat
19
17.1
Key Upcoming Events
Previous
Consensus
Mindtree
812
9.6
Date
Region
Event Description
Reading
Expectations
Fortis
160
9.3
Feb26
US
New home sales
625.00
646.50
Kscl
494
7.4
Feb26
Germany Unemployment change (000's)
(24.00)
Feb27
Euro Zone Euro-Zone Consumer Confidence
0.10
Radico
353
7.1
Feb27
US
Consumer Confidence
125.40
125.70
Feb28
China
PMI Manufacturing
51.30
51.20
Top Losers
Price (`)
Chg (%)
More Events on Pg7
Jubilant
891
(10.2)
Vakrangee
190
(5.0)
Iifl
743
(3.4)
Siemens
1,171
(2.3)
Motilalofs
1,171
(1.8)
As on February 23 2018
Market Outlook
February 26, 2018
News Analysis
Tech Mahindra to invest
$79mn in Canada on AI, blockchain
technologies
IT services provider Tech Mahindra will invest $79 million in Canada over the next
five years to establish a centre of excellence, which will work on major
technologies such as artificial intelligence (AI) and blockchain application. These
two technologies are driving innovation across industries, especially in the 'fintech'
and 'smart cities' spaces.
The centre of excellence will be based out of Toronto and it will focus on jointly
developing cutting-edge business solutions in digital technologies in collaboration
with the leading academic institutes, innovators and accelerators in the start-up
ecosystem like the Vector Institute.
Economic and Political News
Construction of $8-billion natural gas TAPI pipeline launched
NBCC signs MoU for housing project near Delhi's Connaught Place
UP Investors Summit 2018: Rs 660mn spent on Lucknow's beautification
Donald Trump's H1-B visa policy could dampen Indian IT spirit further
Corporate News
Idea Cellular raises Rs 35 billion via QIP, allots 424mn shares to buyers
Religare Enterprises plans to raise Rs 9.16 billion by issuing warrants
NTPC to start ops at 1,600 Mw coal-based power plant in Odisha by 2019
Tech Mahindra to invest $79mn in Canada on AI, blockchain technologies
Market Outlook
February 26, 2018
Top Picks
Market Cap
CMP
Target
Upside
Company
Rationale
(` Cr)
(`)
(`)
(%)
Strong growth in domestic business due to its leade`hip
in acute therapeutic segment. Alkem expects to launch
Alkem Laboratories
26,085
2,182
2,441
11.9
more products in USA, which bodes for its international
business.
Favorable outlook for the AC industry to augur well for
Cooling products business which is out pacing the
Blue Star
7,100
740
867
17.2
market growth. EMPPAC division's profitability to
improve once operating environment turns around.
With a focus on the low and medium income (LMI)
consumer segment, the company has increased its
Dewan Housing Finance
18,076
576
712
23.5
presence in tier-II & III cities where the growth
opportunity is immense.
Loan growth is likely to pick up after a sluggish FY17.
Lower credit cost will help in strong bottom-line growth.
Karur Vysya Bank
7,999
110
160
45.3
Increasing share of CASA will help in NIM
improvement.
High order book execution in EPC segment, rising B2C
KEI Industries
2,926
373
436
16.8
sales and higher exports to boost the revenues and
profitability
Expected to benefit from the lower capex requirement
Music Broadcast
2,088
366
475
29.8
and 15 year long radio broadcast licensing.
Massive capacity expansion along with rail advantage
Navkar Corporation
2,470
164
265
61.5
at ICD as well CFS augur well for the company
Strong brands and distribution network would boost
Siyaram Silk Mills
3,059
653
851
30.4
growth going ahead. Stock currently trades at an
inexpensive valuation.
Market leadership in Hindi news genre and no.
2
viewership ranking in English news genre, exit from the
TV Today Network
2,715
455
508
11.6
radio business, and anticipated growth in ad spends by
corporate to benefit the stock.
After GST, the company is expected to see higher
volumes along with improving product mix. The Gujarat
Maruti Suzuki
2,62,970
8,705
10,619
22.0
plant will also enable higher operating leverage which
will be margin accretive.
We expect loan book to grow at 24.3% over next two
GIC Housing
2,159
401
655
63.4
year; change in borrowing mix will help in NIM
improvement
We expect CPIL to report net Revenue/PAT CAGR of
~17%/16% over FY2017-20E mainly due to healthy
7,003
315
400
26.9
growth in plywood & lamination business, forayed into
Century Plyboards India
MDF & Particle boards on back of strong brand &
distribution network.
We expect sales/PAT to grow at 13.5%/20% over next
LT Foods
3,027
95
128
35.2
two years on the back of strong distribution network &
addition of new products in portfolio.
We expect financialisation of savings and increasing
Aditya Birla Capital
36204
164
230
39.0
penetration in Insurance & Mutual fund would ensure
steady growth.
Third largest brand play in luggage segment Increased
product offerings and improving distribution network is
Safari Industries
1230
530
650
22.4
leading to strong growth in business. Likely to post
robust growth for next 3-4 years
We expect HSIL to report PAT CAGR of ~15% over
FY2017-20E owing to better improvement in operating
HSIL
3081
426
510
19.7
margin due price hike in container glass segment,
turnaround in consumer business.
Source: Company, Angel Research
Market Outlook
February 26, 2018
Fundamental Call
Market Cap
CMP
Target
Upside
Company
Rationale
(` Cr)
(`)
(`)
(%)
CCL is likely to maintain the strong growth trajectory
CCL Products
3,823
287
360
25.3
over FY18-20 backed by capacity expansion and new
geographical foray
We forecast Nilkamal to report top-line CAGR of ~9%
to `2,635cr over FY17-20E on the back of healthy
Nilkamal
2,525
1,692
2,178
28.7
demand growth in plastic division. On the bottom-line
front, we estimate ~10% CAGR to `162cr owing to
improvement in volumes.
We expect sales/PAT to grow at 9%/14% over next two
years on the back of healthy demand growth in
Shreyans Industries
218
158
247
56.4
printing. Further, China had banned making paper
from waste pulp which would benefit Indian paper
companies.
The prism has diversified exposure in the different
segment such as Cement, Tile & ready mix concrete.
Prism Cement
6,335
126
160
27.1
Thus we believe, PCL is in the right place to capture
ongoing government spending on affordable housing
and infrastructure projects.
Source: Company, Angel Research
Market Outlook
February 26, 2018
Key Upcoming Events
Global economic events release calendar
Bloomberg Data
Date
Time Country
Event Description
Unit
Period
Last Reported
Estimated
Feb 26, 2018
8:30 PMUS
New home sales
Thousands
Jan
625.00
646.50
Feb 27, 2018
2:25 PMGermany
Unemployment change (000's)
Thousands
Feb
(24.00)
3:30 PMEuro Zone
Euro-Zone Consumer Confidence
Value
Feb F
0.10
Feb 28, 2018
8:30 PMUS
Consumer Confidence
S.A./ 1985=100
Feb
125.40
125.70
6:30 AMChina
PMI Manufacturing
Value
Feb
51.30
51.20
7:00 PMUS
GDP Qoq (Annualised)
% Change
4Q S
2.60
2.60
Mar 01, 2018
2:25 PMGermany
PMI Manufacturing
Value
Feb F
60.30
3:00 PMUK
PMI Manufacturing
Value
Feb
55.30
Mar 05, 2018
2:25 PMGermany
PMI Services
Value
Feb F
55.30
Mar 07, 2018
3:30 PMEuro Zone
Euro-Zone GDP s.a. (QoQ)
% Change
4Q F
0.60
Mar 08, 2018
China
Exports YoY%
% Change
Feb
11.10
6:15 PMEuro Zone
ECB announces interest rates
%
Mar 8
-
Mar 09, 2018
3:00 PMUK
Industrial Production (YoY)
% Change
Jan
-
7:00 PMUS
Change in Nonfarm payrolls
Thousands
Feb
200.00
200.00
7:00 AMChina
Consumer Price Index (YoY)
% Change
Feb
1.50
7:00 PMUS
Unnemployment rate
%
Feb
4.10
4.10
Mar 12, 2018
5:30 PMIndia
Industrial Production YoY
% Change
Jan
7.10
Mar 13, 2018
6:00 PMUS
Consumer price index (mom)
% Change
Feb
0.50
Mar 14, 2018
12:00 PMIndia
Monthly Wholesale Prices YoY%
% Change
Feb
2.84
US
Producer Price Index (mom)
% Change
Feb
0.70
Mar 15, 2018
India
Imports YoY%
% Change
Feb
26.10
India
Exports YoY%
% Change
Feb
9.10
Mar 16, 2018
6:45 PMUS
Industrial Production
%
Feb
(0.05)
6:00 PMUS
Building permits
Thousands
Feb
1,396.00
Source: Bloomberg, Angel Research
Market Outlook
February 26, 2018
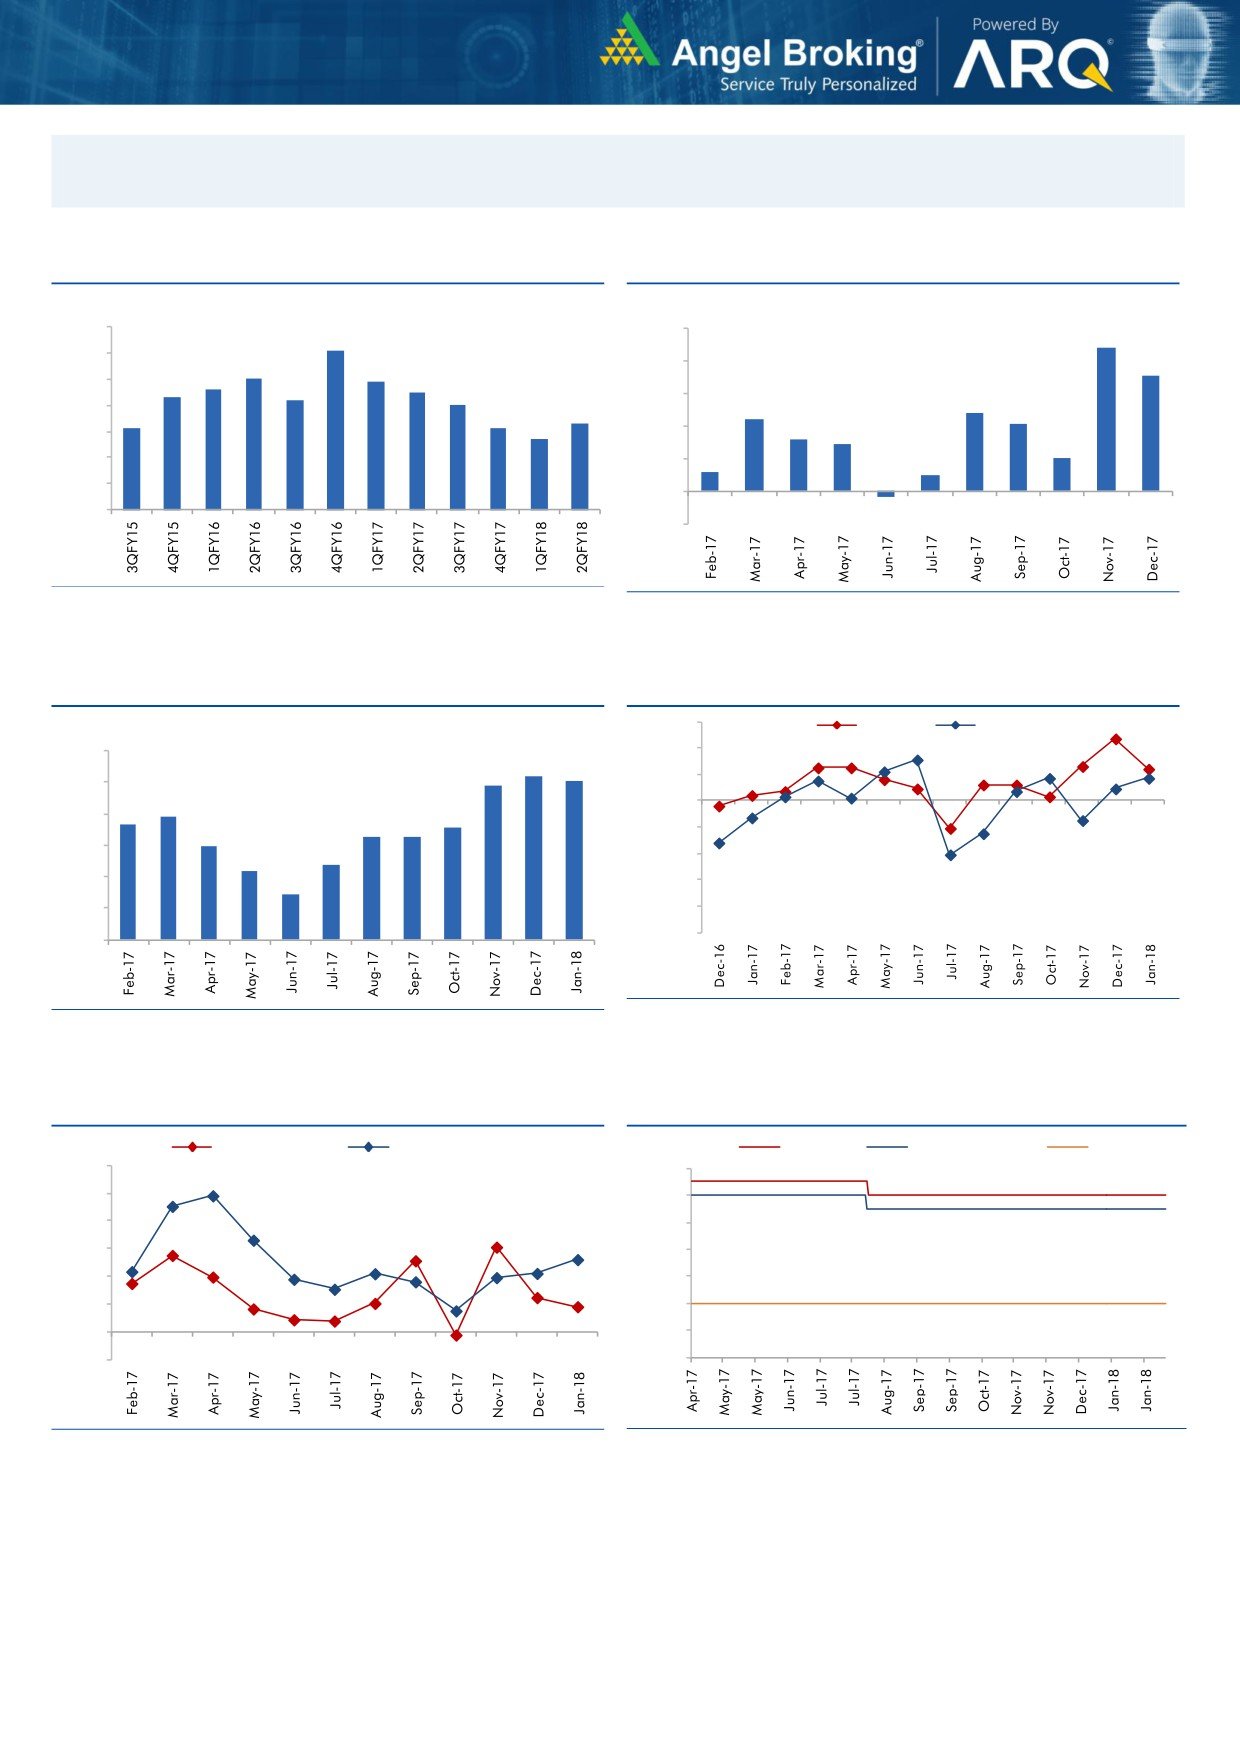
Macro watch
Exhibit 1: Quarterly GDP trends
Exhibit 2: IIP trends
(%)
(%)
10.0
10.0
9.1
8.8
9.0
8.0
7.1
8.0
7.9
7.6
7.5
8.0
7.3
7.2
7.0
6.0
4.8
7.0
6.3
4.4
4.1
6.1
6.1
5.7
4.0
3.2
2.9
6.0
2.0
5.0
2.0
1.2
1.0
4.0
-
3.0
(0.3)
(2.0)
Source: CSO, Angel Research
Source: MOSPI, Angel Research
Exhibit 3: Monthly CPI inflation trends
Exhibit 4: Manufacturing and services PMI
56.0
Mfg. PMI
Services PMI
(%)
6.0
54.0
5.2
5.1
4.9
52.0
5.0
3.9
50.0
3.7
3.6
4.0
3.3
3.3
3.0
48.0
3.0
2.4
2.2
46.0
2.0
1.5
44.0
1.0
42.0
40.0
-
Source: Market, Angel Research; Note: Level above 50 indicates expansion
Source: MOSPI, Angel Research
Exhibit 5: Exports and imports growth trends
Exhibit 6: Key policy rates
(%)
Exports yoy growth
Imports yoy growth
(%)
Repo rate
Reverse Repo rate
CRR
60.0
6.50
50.0
6.00
40.0
5.50
30.0
5.00
20.0
4.50
10.0
4.00
0.0
3.50
(10.0)
3.00
Source: Bloomberg, Angel Research
Source: RBI, Angel Research
Market Outlook
February 26, 2018
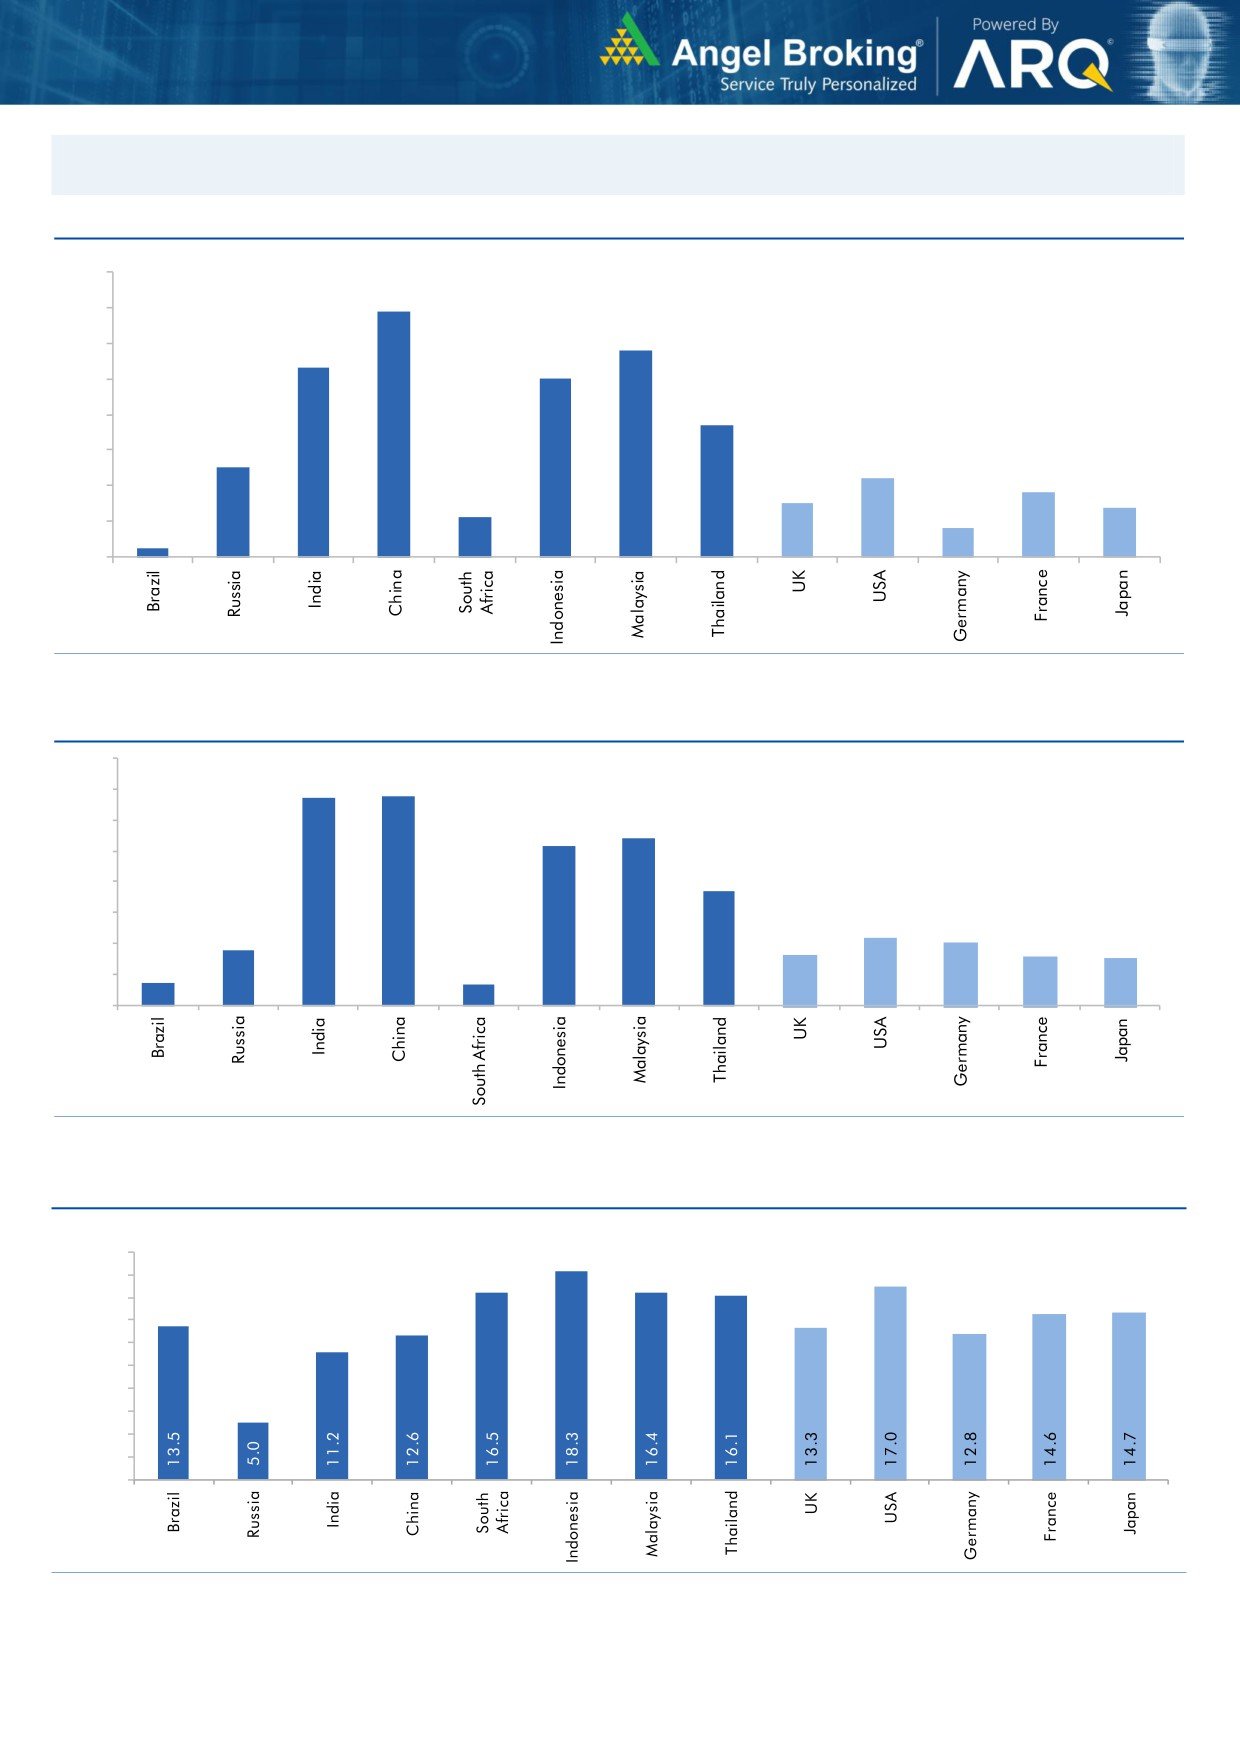
Global watch
Exhibit 1: Latest quarterly GDP Growth (%, yoy) across select developing and developed countries
(%)
8.0
6.9
7.0
5.8
6.0
5.3
5.0
5.0
1.1
3.7
4.0
2.5
3.0
2.2
1.8
2.0
1.5
1.4
0.8
1.0
0.3
-
Source: Bloomberg, Angel Research
Exhibit 2: 2017 GDP Growth projection by IMF (%, yoy) across select developing and developed countries
(%)
6.7
6.8
7.0
6.0
5.4
5.2
5.0
3.7
4.0
3.0
1.8
2.2
2.0
1.7
1.6
2.0
0.7
1.5
0.7
1.0
-
Source: IMF, Angel Research
Exhibit 3: One year forward P-E ratio across select developing and developed countries
(x)
20.0
18.0
16.0
14.0
12.0
10.0
8.0
6.0
4.0
2.0
-
Source: IMF, Angel Research
Market Outlook
February 26, 2018
Exhibit 4: Relative performance of indices across globe
Returns (%)
Country
Name of index
Closing price
1M
3M
1YR
Brazil
Bovespa
87,293
7.5
20.4
30.8
Russia
Micex
2,337
1.6
8.4
10.9
India
Nifty
10,491
(4.3)
1.4
18.2
China
Shanghai Composite
3,289
(5.1)
(2.8)
2.1
South Africa
Top 40
51,747
(5.2)
(5.0)
14.8
Mexico
Mexbol
48,643
(3.2)
0.9
3.0
Indonesia
LQ45
1,110
(1.8)
9.5
23.2
Malaysia
KLCI
1,862
1.8
8.1
8.9
Thailand
SET 50
1,183
(1.0)
8.6
19.9
USA
Dow Jones
25,310
(3.4)
8.0
21.6
UK
FTSE
7,244
(5.2)
(2.4)
(0.1)
Japan
Nikkei
21,893
(9.2)
(2.3)
13.2
Germany
DAX
12,484
(6.9)
(4.1)
5.8
France
CAC
5,317
(3.2)
(0.7)
7.2
Source: Bloomberg, Angel Research p68in4
Market Outlook
February 26, 2018
Research Team Tel: 022 - 39357800
DISCLAIMER
Angel Broking Private Limited (hereinafter referred to as “Angel”) is a registered Member of National Stock Exchange of India
Limited,Bombay Stock Exchange Limited and Metropolitan Stock Exchange Limited. It is also registered as a Depository Participant with
CDSL and Portfolio Manager with SEBI. It also has registration with AMFI as a Mutual Fund Distributor. Angel Broking Private Limited is a
registered entity with SEBI for Research Analyst in terms of SEBI (Research Analyst) Regulations, 2014 vide registration number
INH000000164. Angel or its associates has not been debarred/ suspended by SEBI or any other regulatory authority for accessing
/dealing in securities Market. Angel or its associates/analyst has not received any compensation / managed or
co-managed public offering of securities of the company covered by Analyst during the past twelve months.
This document is solely for the personal information of the recipient, and must not be singularly used as the basis of any investment
decision. Nothing in this document should be construed as investment or financial advice. Each recipient of this document should make
such investigations as they deem necessary to arrive at an independent evaluation of an investment in the securities of the companies
referred to in this document (including the merits and risks involved), and should consult their own advisors to determine the merits and
risks of such an investment.
Reports based on technical and derivative analysis center on studying charts of a stock's price movement, outstanding positions and
trading volume, as opposed to focusing on a company's fundamentals and, as such, may not match with a report on a company's
fundamentals. Investors are advised to refer the Fundamental and Technical Research Reports available on our website to evaluate the
contrary view, if any.
The information in this document has been printed on the basis of publicly available information, internal data and other reliable
sources believed to be true, but we do not represent that it is accurate or complete and it should not be relied on as such, as this
document is for general guidance only. Angel Broking Pvt. Limited or any of its affiliates/ group companies shall not be in any way
responsible for any loss or damage that may arise to any person from any inadvertent error in the information contained in this report.
Angel Broking Pvt. Limited has not independently verified all the information contained within this document. Accordingly, we cannot
testify, nor make any representation or warranty, express or implied, to the accuracy, contents or data contained within this document.
While Angel Broking Pvt. Limited endeavors to update on a reasonable basis the information discussed in this material, there may be
regulatory, compliance, or other reasons that prevent us from doing so.
This document is being supplied to you solely for your information, and its contents, information or data may not be reproduced,
redistributed or passed on, directly or indirectly.
Neither Angel Broking Pvt. Limited, nor its directors, employees or affiliates shall be liable for any loss or damage that may arise from
or in connection with the use of this information.